4 Use Case 2: Multifunctional Landscape Analysis
Carbon density maps provide only one part of the evidence required for landscape management and planning strategies. In addition to understanding the impact of land management practices and land use change on carbon storage and emissions, it is also important recognise the multiple impacts on biodiversity and various other ecosystem services such as flood prevention, food and water supply, cultural and recreational benefits etc. These direct environmental implications of planning projects need to be understood alongside the economic and social benefits associated with them so that holistic strategies for land use change can take account of the diverse interests of multiple stakeholders.
For example, it makes sense to develop Local Nature Recovery Strategies (LNRS) based not only on a wide range of biophysical information (carbon, biodiversity, habitat quality and connectivity, flood risk etc.) but also in connection with other land use policies which have implications for the LNRS. One such policy is the The Strategic Housing and Economic Land Availability Assessments (SHELAA) carried out by district authorities to identify plots of land suitable for housing and commerical development. Another is the Biodiversity Net Gain (BNG) legislation which requires new developments to replace lost habitats with on-site and off-site habitat creation or improvements. By integrating map outputs from sources such as SHELAA and BNG analysis with carbon density and other biodiversity datasets in LIMMMA we can begin to create a platform to support LNRS consultations involving decision makers, community stakeholders and researchers. LIMMMA can thus enable a collaborative process of developing opportunity maps for LNRS and support ongoing monitoring of the implementation and impacts of individual projects across the landscape.
Working with Wealden District Council and the Sussex LNRS we have begun to explore the potential for such an approach and to design new features which can be added to LIMMMA to facilitate these type of collaborative processes. Here we present a series of demonstration projects in LIMMMA which illustrate the power and flexibility for using the platform in multifunctional landscape analysis.
4.1 Creating opportunity maps
The Climate Change Committee estimated that, to meet national carbon net zero commitments, UK woodland cover needs to increase from the current 13% to 19% by 2050.1 One important method of increasing woodland cover is through natural regeneration whereby grassland adjacent to existing woodland is managed in such a way as to allow trees and shrubs to self seed and mature until the new woodland is naturally established. To communicate the potential for natural regeneration to expand woodland cover we need to locate all areas of land that might be suitable and present them as an “Opportunity Map” which can then be used as a basis for designing land-management strategies and LNRS.
Current features of LIMMMA already support the creation of opportunity maps based on combinations of criteria for site selection derived from loaded datasets (see below). The resulting maps can be iteratively modified in consultation with local stakeholders by adjusting selection criteria or by uploading additional datasets (e.g. locally created habitat maps or Natural England’s Habitat Network maps and Priority Habitats Inventory). However, the process of uploading new datasets still relies on technical support from the Sussex research team, meaning it is not as user friendly as we would like. Although we plan to add the capability for users to upload their own datasets without extra help, we recognise the value of being able to create and edit maps within the LIMMMA platform itself. So to makes things easier for non-expert users we are working on a new feature to enable users to manually edit map layers and enrich them with their own experiential knowledge directly in the LIMMMA interface.
The following are worked examples of how to create an opportunity map by using a combination of datasets and model components to identify areas which match a specific set of criteria. Note, this is only a demonstration of the capabilities of LIMMMA and should not be taken as evidence in support of any specific land-use change strategies.
4.1.1 Identify candidate land cover
The first thing to do is to consider what type of habitat would be suitable for natural regeneration of woodland. Let us assume that arable farmland is automatically excluded for food security reasons and that, therefore, grassland is the main candidate for woodland expansion. To get an initial idea of the scope for expanding woodland onto grassland areas we can add the UKCEH habitat map as a categorical map layer. Here is how we can use a land cover map to begin the process of creating an opportunity map in LIMMMA:
Examination of the UKCEH Land Cover map reveals two types of grassland present in the target area: “Improved Grassland” and “Calcareous Grassland.” Calcareous Grassland is a rare and unique habitat that we should not be considering as a candidate for woodland expansion. This leaves Improved Grassland as the basic habitat type to start with. Now we need to refine our search for candidate grassland sites by adding some additional criteria.
4.1.2 Set criteria for site selection
We could use proximity to woodland and urban/suburban areas to further narrow down our site selection. For example, Improved Grassland situated adjacent to woodland and beyond a certain distance from built-up areas might represent our preferred locations for natural regeneration. The basic structure of this operation is to use two clusters of “Distance Map”, “Greater/Less”, and “Numeric Constant” components with set operation components (“Union” and “Intersection”) to filter the candidate areas (in this case grassland) according to distance from woodland and urban/suburban. The following slides walk you through the steps to build the model.
Of course this is a very simple example, but it demonstrates the basic principle of how to refine your search for candidate sites by progressively adding limiting conditions. These conditions need not be restricted to proximity to other habitats or land cover but could also include other biophysical datasets. For example you might set thresholds for rainfall, soil conditions, slope, land tenure or designations etc. Or you could use flood risk data to prioritise certain at risk areas for woodland regeneration to improve natural flood prevention. On the other hand, you could use biodiversity data to identify areas of woodland with high populations of specific species which would benefit from an expansion of their already existing habitat into adjacent grassland.
4.1.3 Exclude areas from site selection
It might also be necessary to exclude specific areas from your site selection because, for example, they are designated conservation areas in which grasslands are managed carefully to preserve their unique biodiversity. Filtering out specific areas from the candidate site selection is a straightforward matter of using set operations to define the excluded areas.
4.1.4 Separate candidate sites by priority
Now let’s say we want to prioritise candidate sites which are adjacent to Ancient Woodlands. Using another cluster of “Distance Map”, “Less” and “Numeric Constant” we can split the output from the candidate site selection according to proximity to Ancient Woodland.
What we have done so far is progressively narrow down the candidate site selection through a combination of proximity conditions and excluding various types of protected area. It is also possible to perform a more sophisticated analysis to identify priority areas based on the scope for connecting woodland fragments to create larger continuous woodland habitats.
4.1.5 Identifying habitat fragments
The first step in this process is to generate a new map layer which identifies fragmented woodland and classifies woodland areas into two types: isolated and continuous.
4.1.6 Identifying continuous candidate habitats
The next step is to generate a map of continuous areas of Improved Grassland which have edges directly adjacent to existing woodland. This will filter out isolated patches of grassland and ensure that our candidate sites only include areas of grassland with the potential for connecting to existing woodland.
Now let’s say we want to restrict our search for candidate sites to those areas which connect to Ancient Woodland so we can prioritise natural regeneration around these areas. To do this we can modify the model we just created to 1) narrow down the starting condition and 2) filter the final output.
4.1.7 Putting it together
Finally, we can bring the outputs from the fragmentation and continuity analyses together to find priority candidate areas to improve woodland connectivity. By creating a new project into which to bring the saved outputs from the previous analyses we can further filter the candidate sites using additional conditions. In this example, we will exclude all areas within already conserved habitats based on the designation of sites as nature reserves, sites of special scientific interest etc.
4.1.8 Potential new features
Now we have seen how to create an opportunity map, refine it and add outputs as a categorical map layer we can turn to the anticipated new features designed to make the process of creating opportunity maps easier and more flexible.
The functions described above provide a flexible way of creating opportunity maps based on landscape characteristics (e.g. land cover types and biophysical conditions) and socio-economic data (e.g. indicators of deprivation). However, the resulting maps can only be used as a foundation or starting point for developing land-use strategies because they do not take into account the peculiarities of local contexts or the experiential knowledge of local communities.
Technically, this local and contextual information can be imported into LIMMMA once it has been gathered and processed using other software. However, it would be preferable to be able to capture such insights from within the LIMMMA platform itself so that the data could be used directly to improve the selection of candidate sites. For example, Farm Clusters may propose specific interventions on sections of their owned land which they could add the opportunity map. Or community conservation groups might want to be able to identify on the map specific areas they know to be of high importance for endangered species. Focus groups with local residents might reveal important information about access, use and quality of particular locations which would otherwise remain undifferentiated in habitat maps but which have implications for their suitability for specific types of intervention. Each of these examples call for a function that enables the user to edit, draw on and annotate map layers in Map view to save for use in Model view. Below is a mock-up of how this “Map drawing” function might work.
4.2 Visualising scenarios
Another application of this potential new function would be to enable the design of bespoke land-use change scenarios within LIMMMA in consultation with local stakeholders. Although scenario maps made in other software can already be imported into LIMMMA with support from the Sussex technical team, it would be much easier for users if they could create such maps directly within LIMMMA itself. Once the new function is completed, it would enable users design land-cover maps from scratch or modify existing map layers to create new ones and to use these layers in models to analyse the potential impacts of proposed land-use changes on multiple outcomes.
The capability to generate this type of scenario analysis once scenario maps have been created is quite straightforward and relies on LIMMMA’s functionality for saving model outputs for use as datasets in new models. For example the carbon density maps generated in the AGC project could be imported into a project which combined the woodland opportunity map and a housing and commercial development plan map to explore the potential impact of implementing LNRS alongside other land-use plans on carbon storage.
4.2.1 Potential new features
To model the potential outcomes of individual NBS or land-use change strategies across large-scale multifunctional landscapes we understand that it is important not only to develop indicators of carbon storage and biodiversity improvement but also to develop proxies for the benefits obtained by a diversity of stakeholders across a range of values from economic to cultural and wellbeing benefits. In previous work in India and China we have begun to develop a method to model and visualize the impacts of land-use change on multiple stakeholders in peri-urban contexts.
Value perceptions
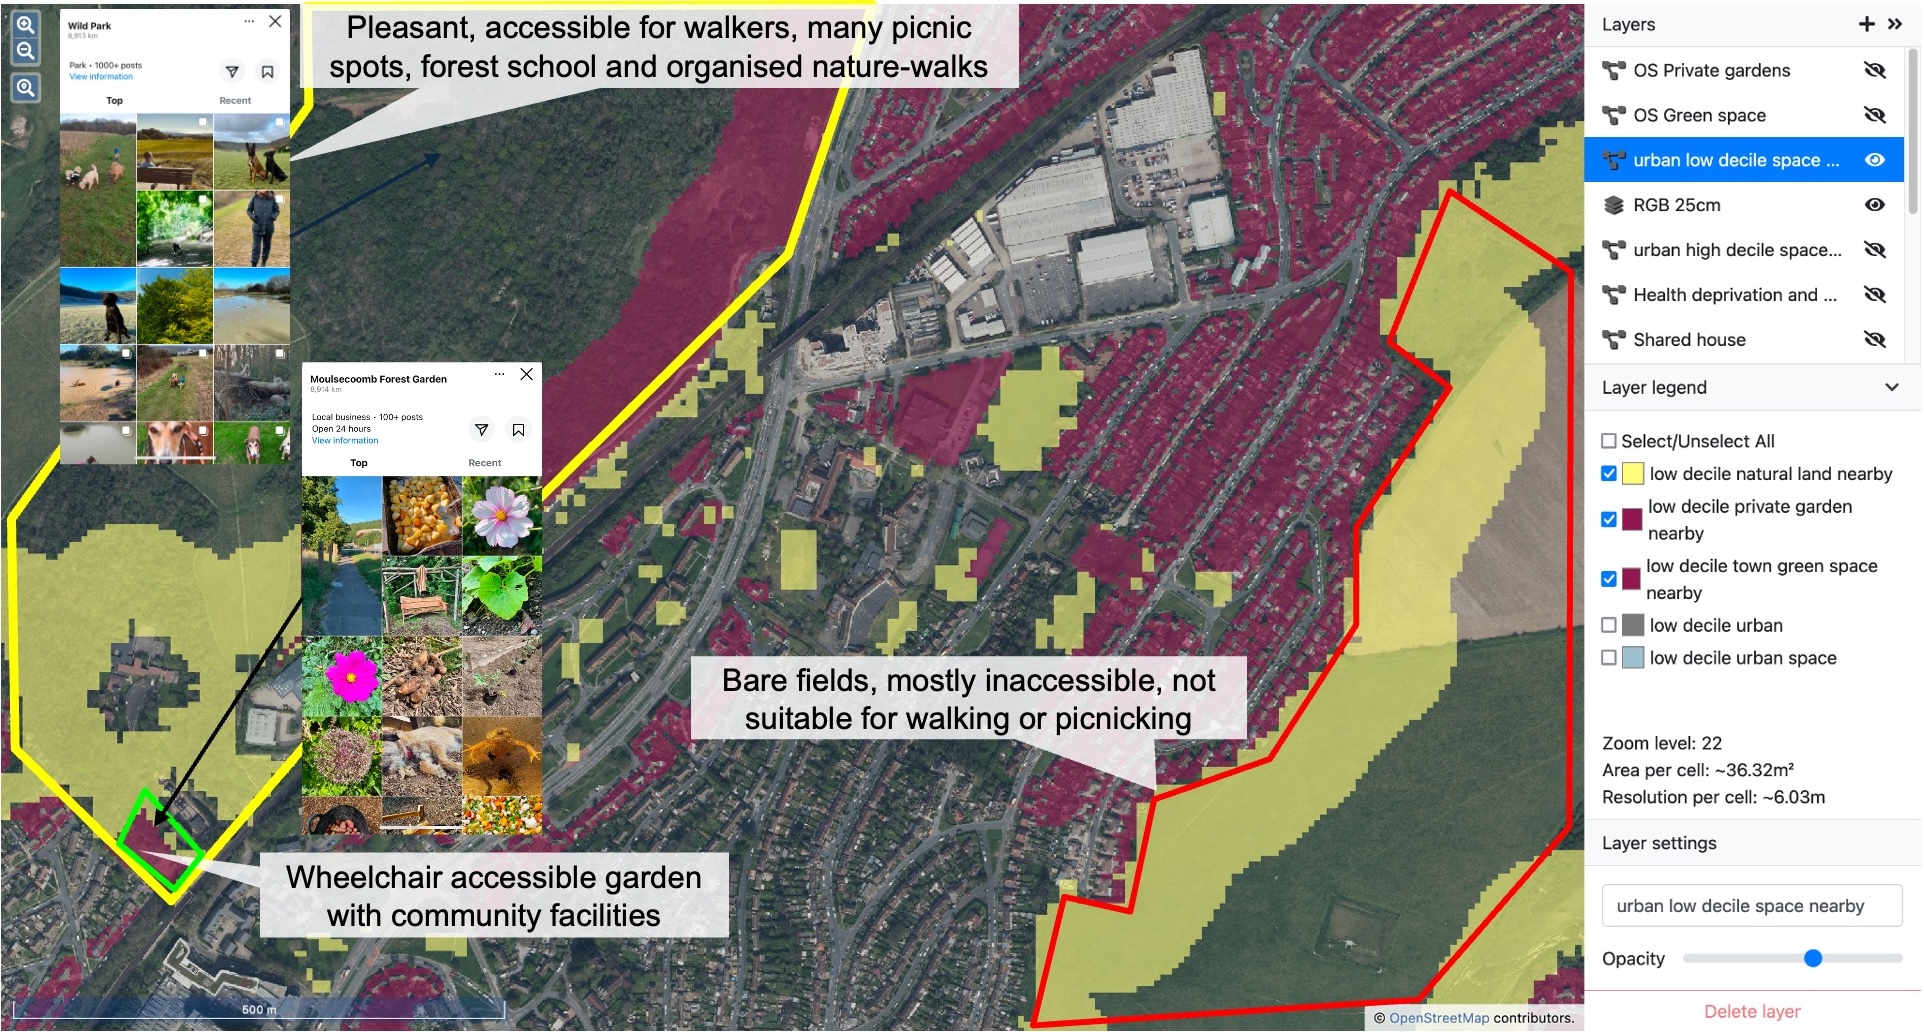
The method begins with stakeholders identifying specific landscape features, habitats and land-uses that matter to them in some way and identifying the range of outcomes they derive from these. As an illustration, the following image shows how a wild park site might be perceived by different stakeholders including low- and high-income residents, the local planning authority and the LNRS team.
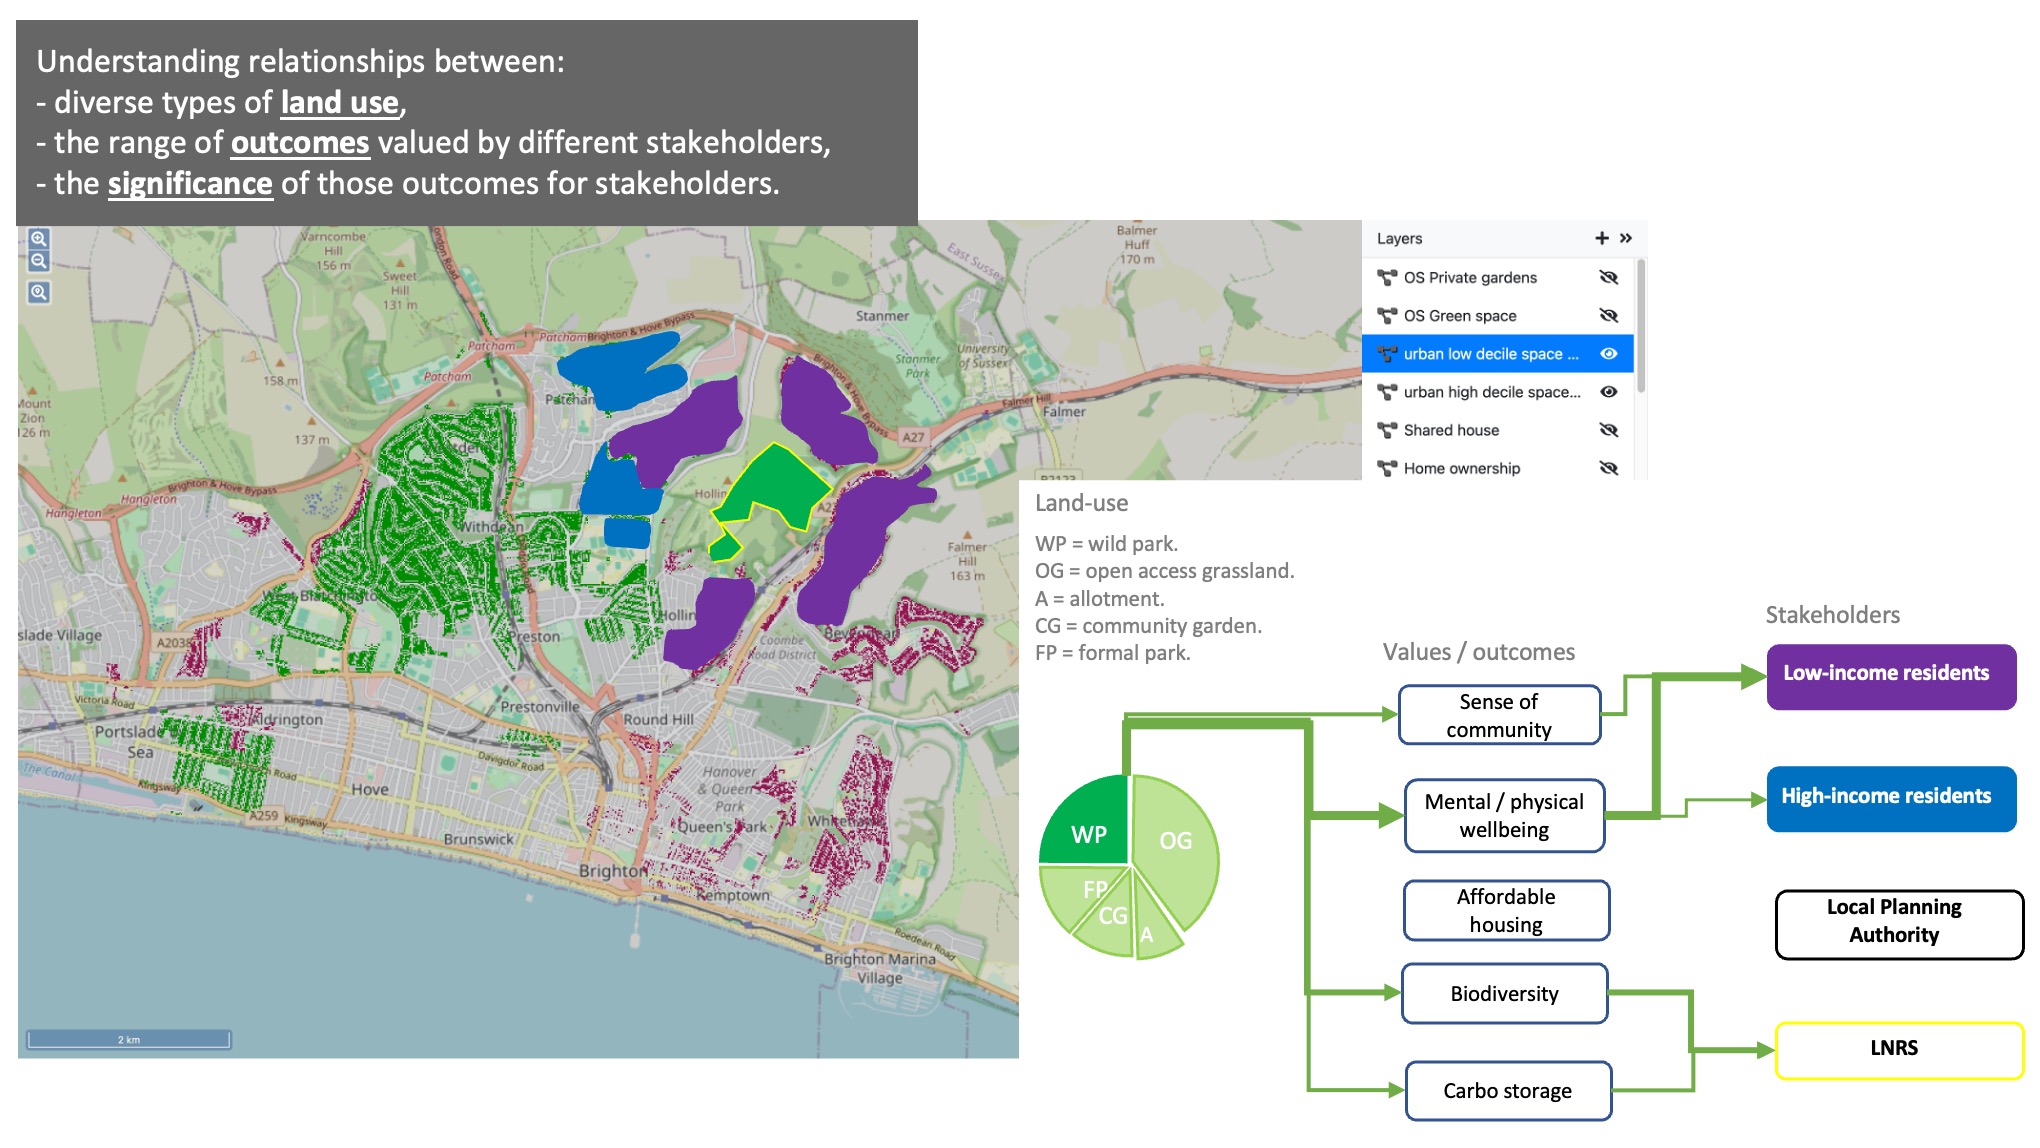
Next each stakeholder or group of stakeholders would determine a significance score for each combination of land-use and outcome to express the impact of: 1) loss of access; 2) change in type of access; 3) gain in access, to that land-use type along with what conditions would define loss, change and gain in this context.
Visualising trade-offs
The consequence of a combination of land-use changes across a landscape can then be modelled in terms of its relative positive and negative impacts on various stakeholders for a range of outcomes. In the mock-up below, the map displays the combination of land-use changes while the graph displays net outcome of those changes.
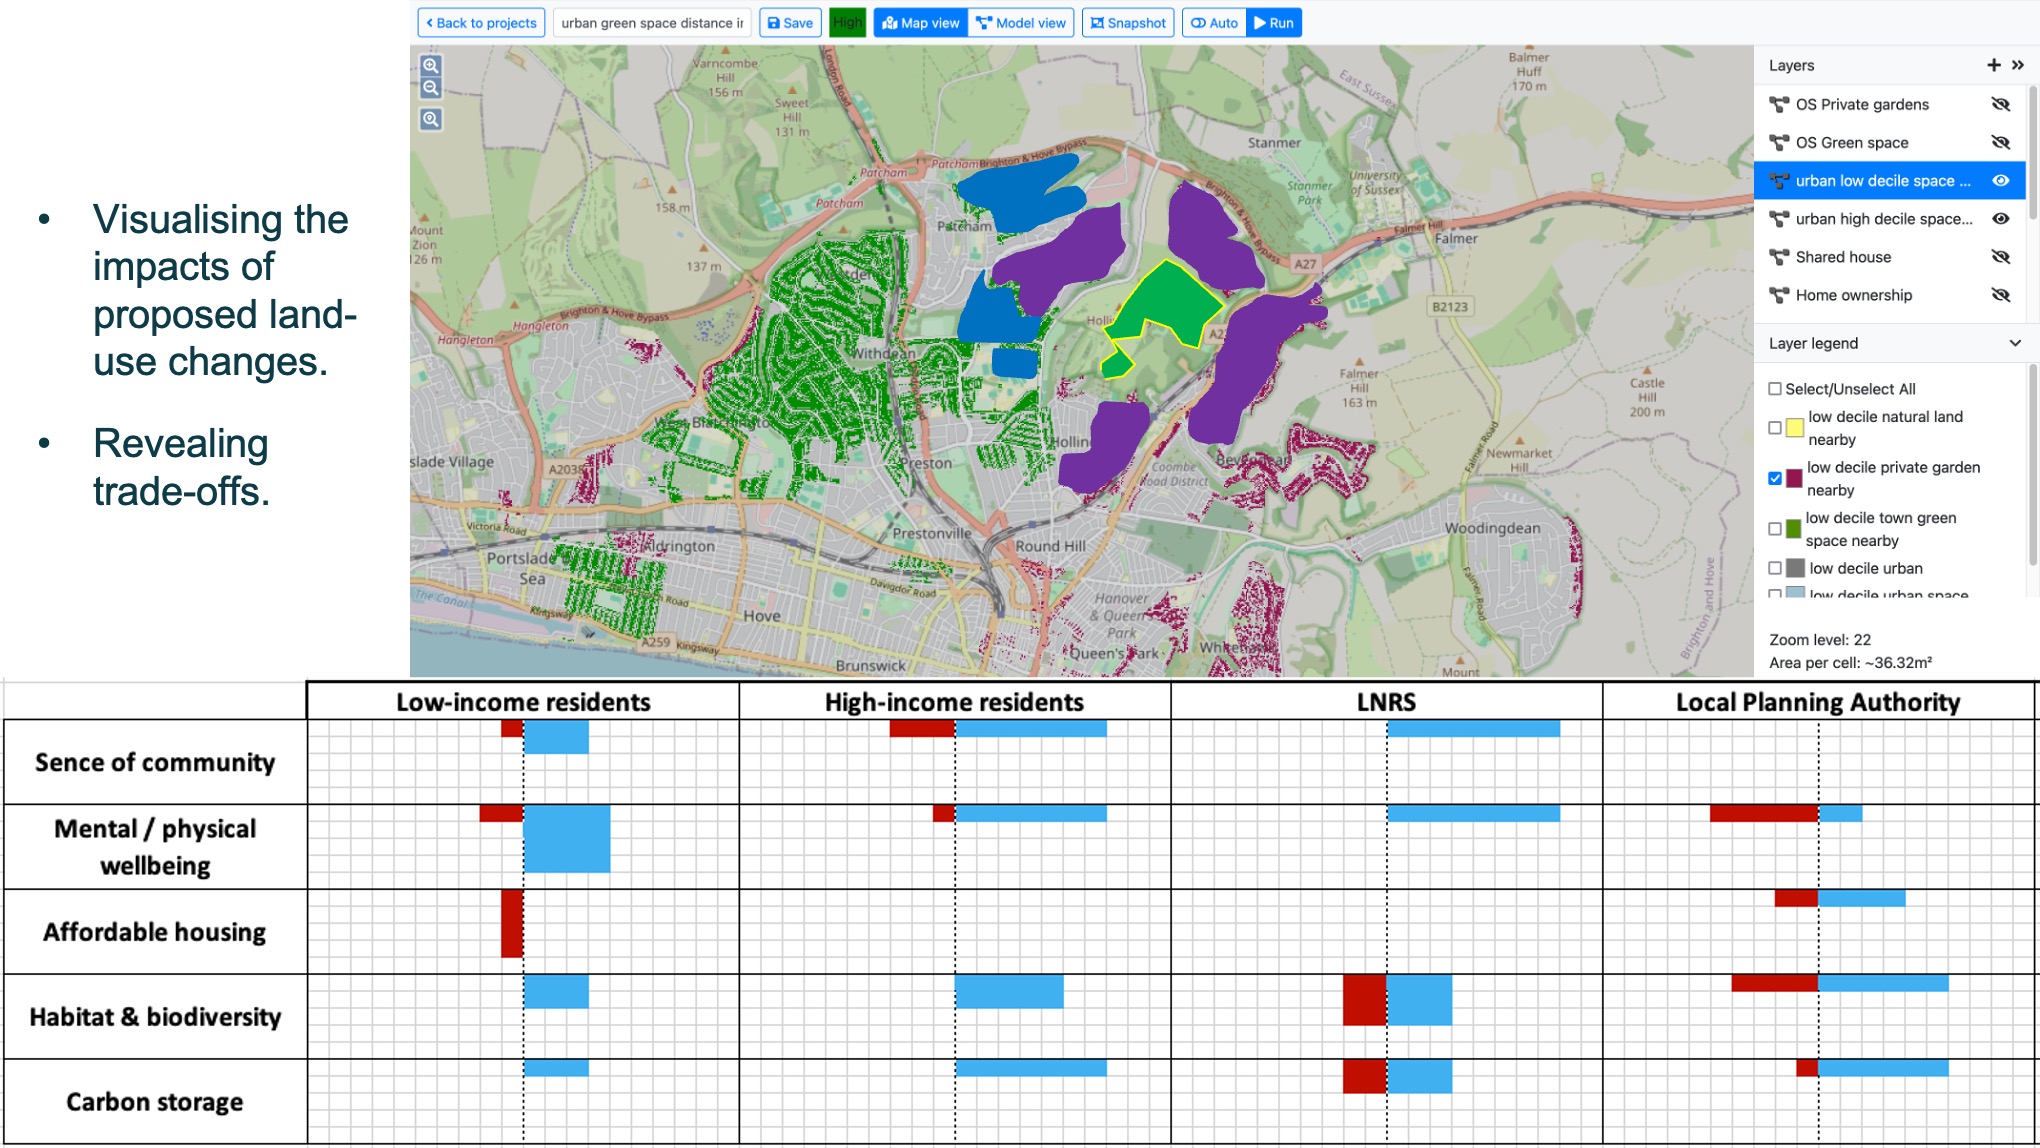
In the visual, positive impacts are represented by blue bars and negative by red. The length of bars indicates the scale of the impact according to the area of land involved which could also be modified for other parameters such as population density. The height of the bars represents the significance of the impact as indicated by stakeholders themselves. The idea is that this visualisation provides an entry point for discussion about the trade-offs and synergies between different outcomes and policy goals for any given strategy of land-use change. While we have not yet implemented this functionality in the current version of LIMMMA we see an opportunity to develop it and build it into future work to support LNRS and local planning and to support the development of virtual living labs.
https://www.woodlandtrust.org.uk/plant-trees/natural-regeneration/↩︎